![]()
Result Summary
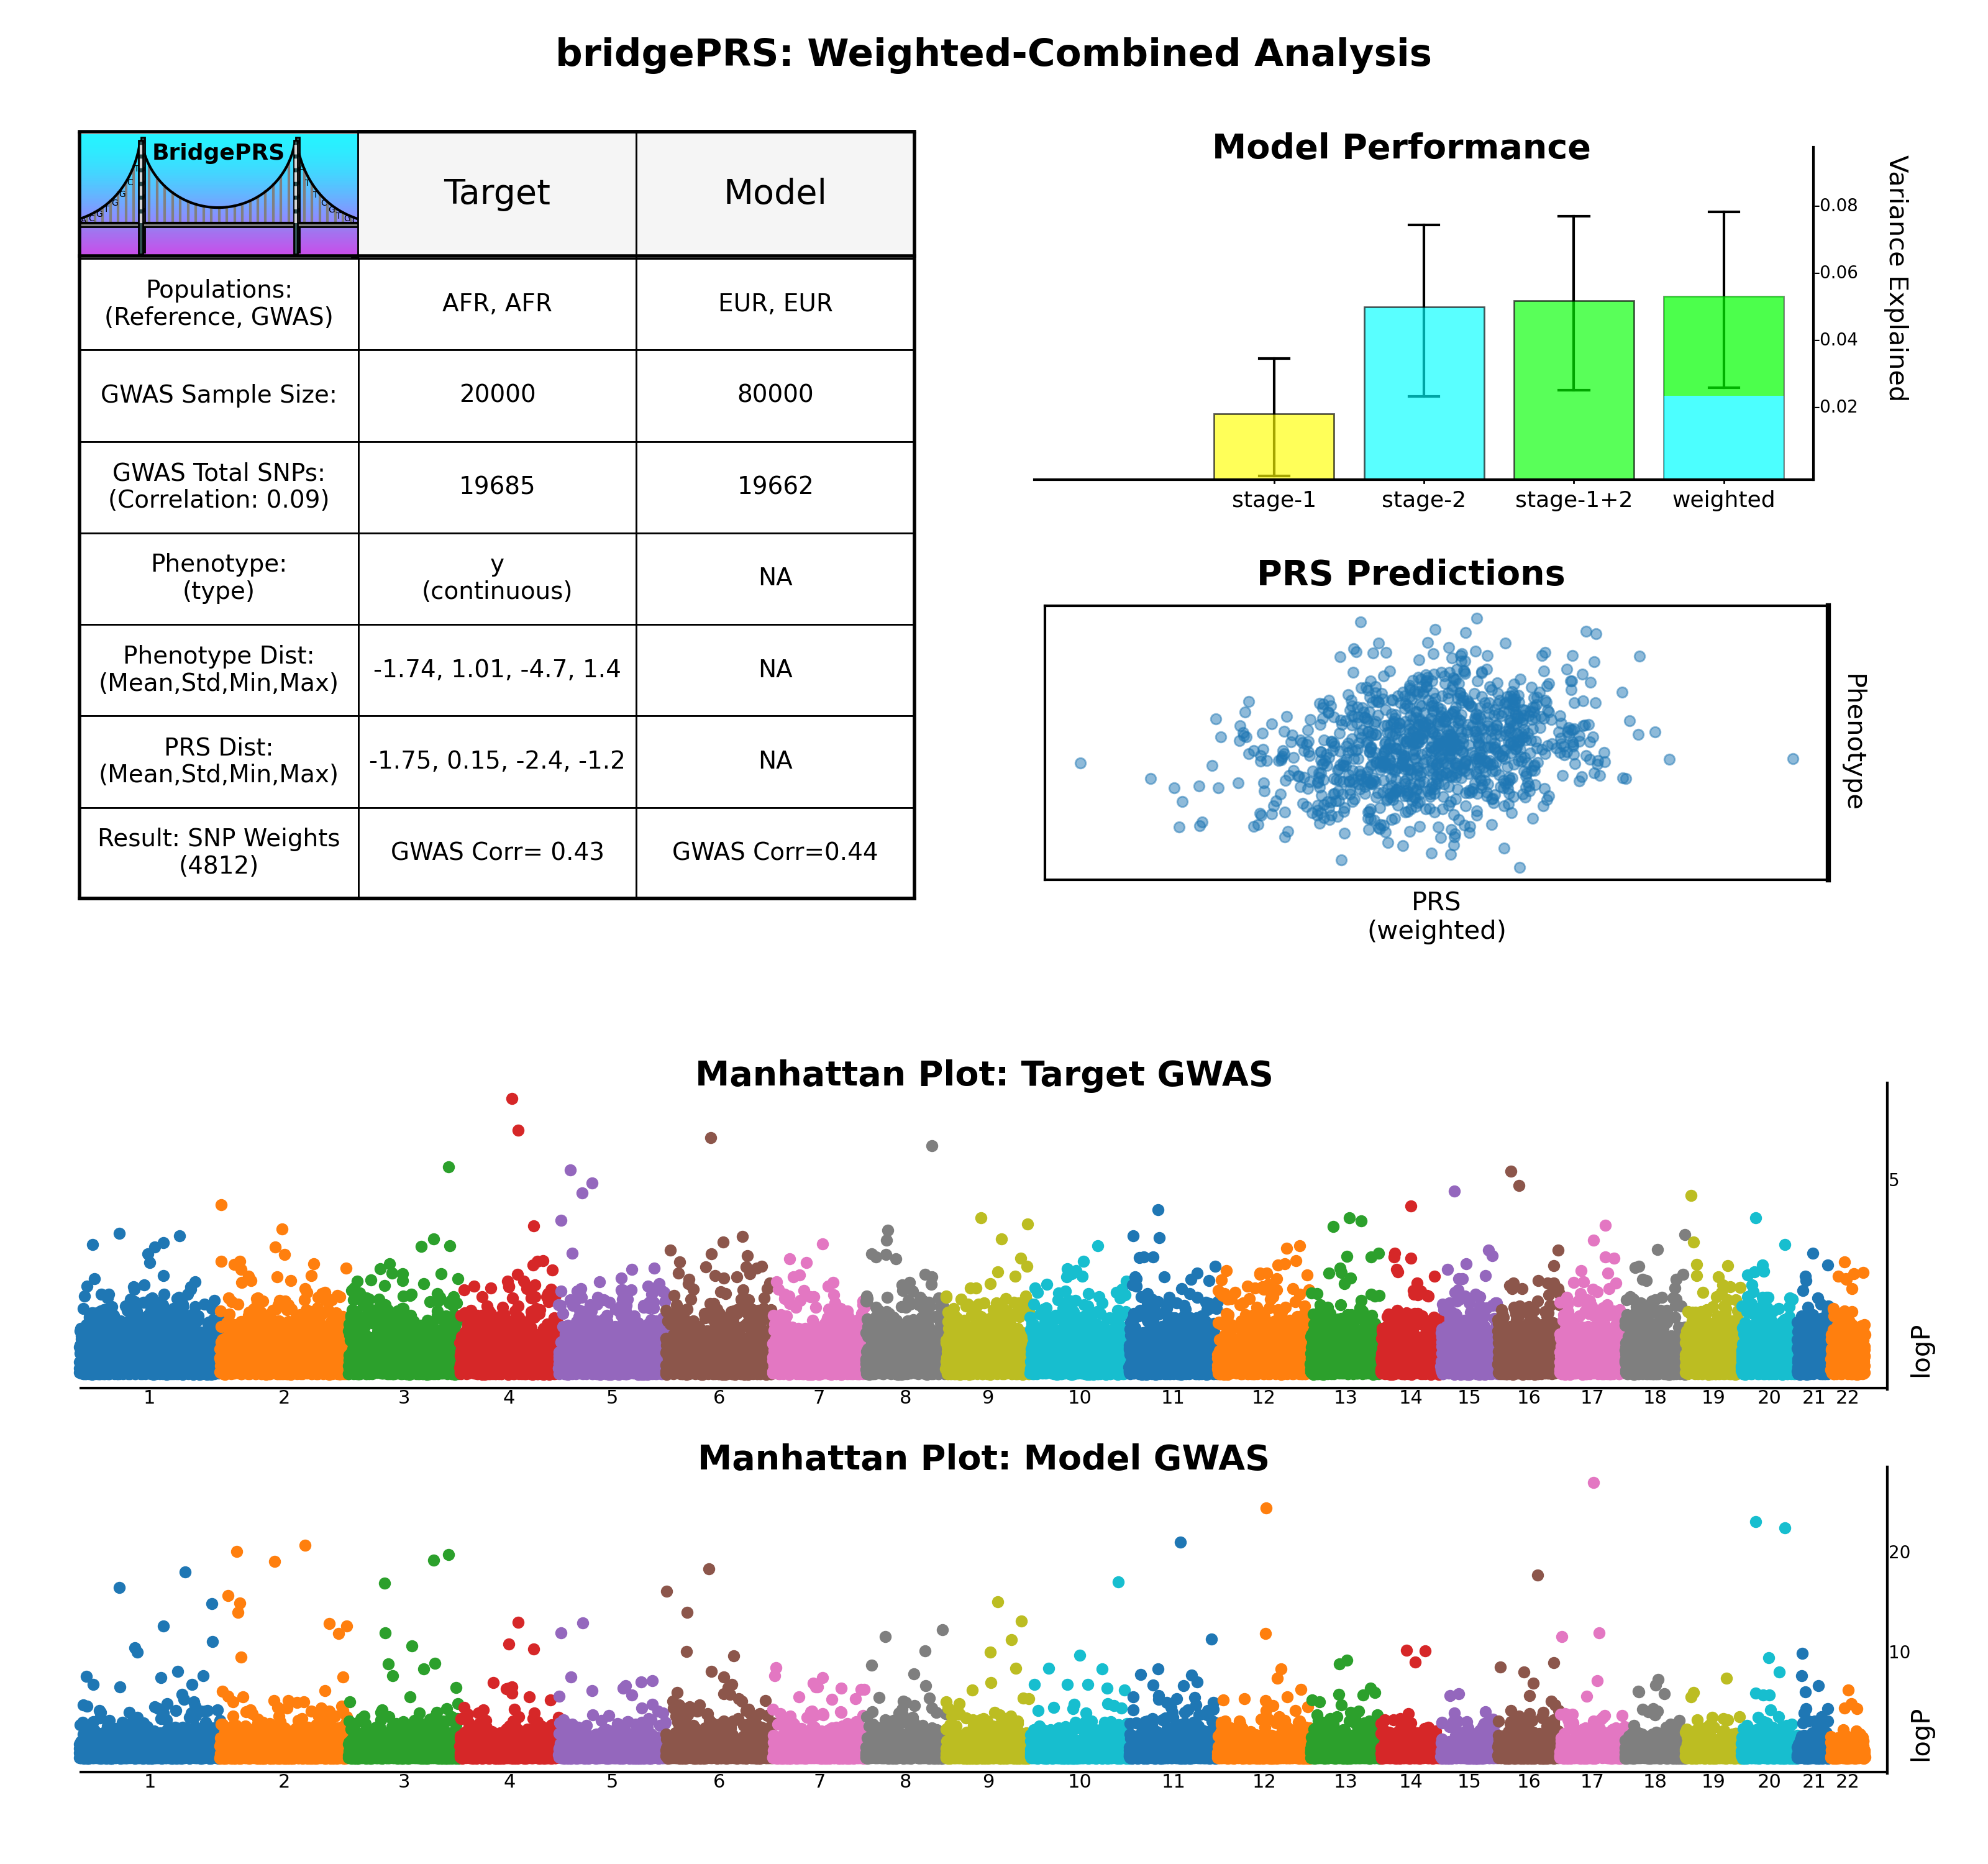
For each bridgePRS run, verify that summary figures out1/bridgeSummary.png (shown below) and
out2/bridgeSummary.png have been created.
Moving clockwise the summary figure displays basic summary statistics (top left), the model performance (in terms of \(R^2\)) for each step in the pipeline, a scatterplot (continuous variables) or boxplot (binary variables) for the final (weighted) model, and a manhattan plot for the GWAS file(s) used.
Detailed Result
The bridgePRS pipeline also creates detailed files that describe the SNPS weights, trait predictions (PRS values), and the
performance at each stage in the model. For the continuous demo run the final versions of these file(s) can be found
with the output prefix out1/prs-combined_AFR-EUR/AFR_weighted_combined. For description of each output filetype please see
the output section of the guide.